
Can you define what value is?
When you, as the producer benefit from a product, you are receiving value. This value / producer benefit can be either:
- Money
- Improving society
Value is only realized after the product (or a version of it) is RELEASED.
Therefore the quicker the first release the quicker ‘return on investment’ starts to be realized.
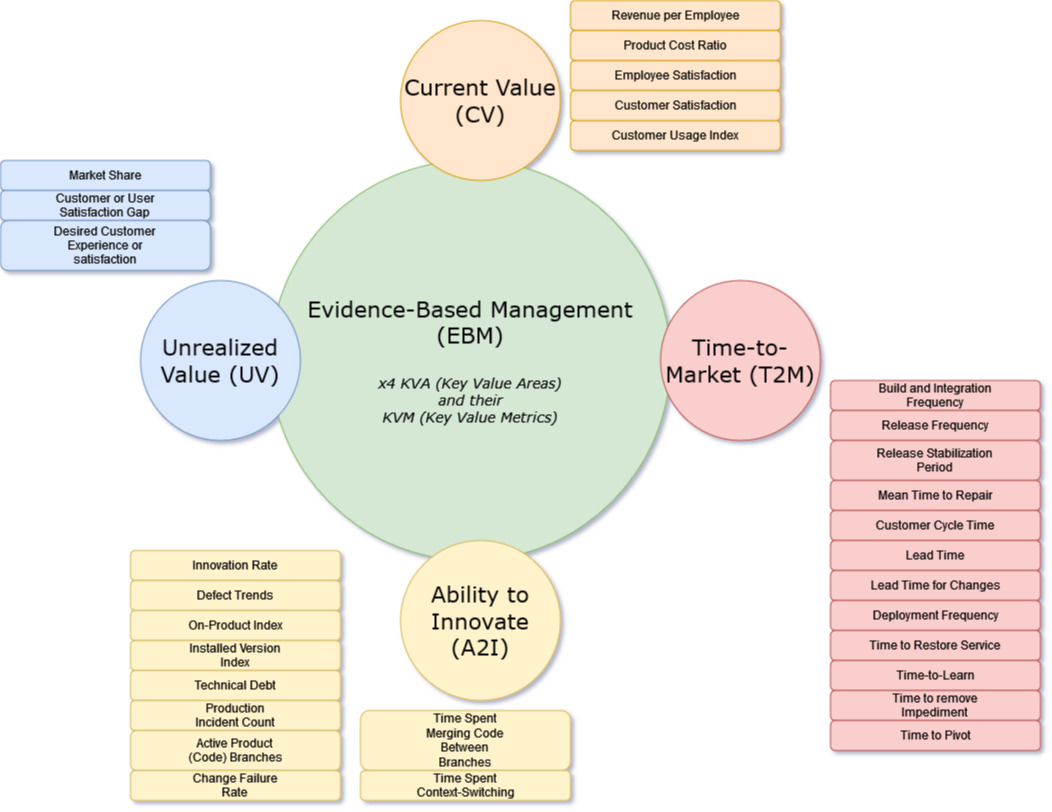
EBM – Evidence Based Management
Evidence-Based Management is the process of using data to make decisions and create strategies for a business.
Evidence-Based Management is becoming increasingly popular in today’s business world. It is the process of using data to make decisions and create strategies for a business. Companies are increasingly recognizing the value of using data to inform their decisions, as well as the potential advantages that evidence-based management can bring to their operations. Evidence-Based Management is being embraced by companies in a range of industries, from healthcare to manufacturing, and its popularity is only likely to grow in the future.
EBM is not limited to agile companies. The approach can be employed by businesses of any size and in any industry. That said, agile companies may be particularly well-suited to Evidence-Based Management, as they are better-equipped to quickly analyze data and use it to inform their decisions and strategies.
Metrics
EBM does not tell you what metrics to measure, thus allowing the framework to remain adaptable. The metrics below are some of those commonly used cross industries:
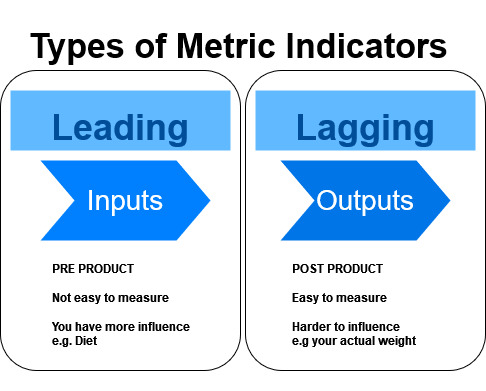
Note that when looking at any metrics or data that you keeping mind whether it is a leading or lagging indicator.
Tracking Metrics Methodologies
Ensure metrics are value neutral: Keep them free from influence and judgement. There is not good or bad information; there is only the current reality. This is what is meant by value neutrality.
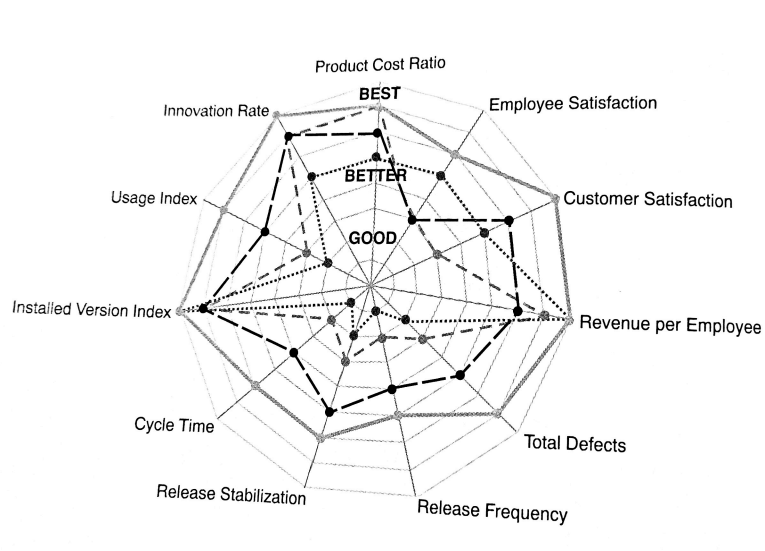
Spider Graph
An important aspect of putting value metrics in place is establishing the discipline to remeasure over time. The trends that emerge are as important as the data itself. Use to show metric changes over time.
Scoreboard Style Spreadsheet
Divide it into:
- Circumstantial progress metrics
- Leading metrics
- Lagging metrics